How Much does Crowd Noise Affect NBA Players?
Posted on August 11, 2020 in NBA-Basketball
Premise
Basketball is back in the bubble! But it's been drastically different with virtual fans and the lack of crowd noise. I was curious to see the effect that crowd noise had on the players, and the most "controlled" aspect of the game I could think of was free throws. Therefore I wanted to see if player's free throw percentages improved due to the lack of crowd noise or not.
I used a matched pairs t-test to see whether a "bubble" effect existed on the NBA player's free throw percentage pre-bubble vs in the bubble. One of the disadvantages of the matched pairs t-test was that this treated the pre-bubble data as a single measurement point and the in-bubble data as another measurement point, but the data was actually binomial data.
Therefore, I also used a test of proportions to see whether any players deviated from their pre-bubble free throw shooting percentages
Load the data
I first loaded the box score data that was scraped from basketballreference.com using the code here
I then created dictionaries of each player's pre-bubble / bubble free throws made and free throw attempts. Thankfully no players in the NBA have the same name
import os
from os import path
import pickle
import pandas as pd
from scipy import stats
import numpy as np
import pylab
from statsmodels.stats.proportion import proportions_ztest
import matplotlib.pyplot as plt

def RepresentsInt(s):
    try:
        int(s)
        return True
    except ValueError:
        return False

working_dir = os.getcwd() + "/ft_data"
# Get all pickle files that match basic box score in the 2020 season
pre_bubble_box_scores = dict()
bubble_box_scores = dict()
for file in os.listdir(working_dir):
    if file.endswith(".pickle") and "basic_box_score" in file and "2020" in file:
        with open(working_dir + "/" + file, 'rb') as handle:
            b = pickle.load(handle)
            if 'july' in file or 'august' in file:
                bubble_box_scores.update(b)
            else:
                pre_bubble_box_scores.update(b)

pre_bubble_players_ft_attempts = dict()
pre_bubble_players_ft_made = dict()
debug = list()
for key, boxscore in pre_bubble_box_scores.items():
    ft_attempts = boxscore['FTA']
    ft_made = boxscore['FT']
    for index, value in ft_attempts.items():
        if RepresentsInt(value):
            if int(value) != 0:
                if index not in pre_bubble_players_ft_attempts.keys():
                    pre_bubble_players_ft_attempts[index] = int(ft_attempts[index])
                    pre_bubble_players_ft_made[index] = int(ft_made[index])
                else:
                    pre_bubble_players_ft_attempts[index] = pre_bubble_players_ft_attempts[index] + int(ft_attempts[index])
                    pre_bubble_players_ft_made[index] = pre_bubble_players_ft_made[index] + int(ft_made[index])

bubble_players_ft_attempts = dict()
bubble_players_ft_made = dict()
for key, boxscore in bubble_box_scores.items():
    ft_attempts = boxscore['FTA']
    ft_made = boxscore['FT']
    for index, value in ft_attempts.items():
        if RepresentsInt(value):
            if int(value) != 0:
                if index not in bubble_players_ft_attempts.keys():
                    bubble_players_ft_attempts[index] = int(value)
                    bubble_players_ft_made[index] = int(ft_made[index])
                else:
                    bubble_players_ft_attempts[index] = bubble_players_ft_attempts[index] + int(value)
                    bubble_players_ft_made[index] = bubble_players_ft_made[index] + int(ft_made[index])
Create the data frame
Next, I created a dataframe with the columns desired and ran through the players in the bubble to populate the the dataframe. I only took players who had taken at least 20 free throws in the pre-bubble as well as bubble.
- Player
- Pre-Bubble Free Throws Made
- Pre-Bubble Free Throws Attempted
- Bubble Free Throws Made
- Bubble Free Throws Attempted
- P-value of the difference between the two proportions
- Pre-bubble Free Throw %
- Bubble Free Throw %
- Differences of Pre-bubble vs Bubble
Analysis
Test of Proportions
We had a total of 56 players who as of 8/10/2020 had taken more than 20 free throws in the bubble. Only 4 of them had significantly different free throw percentages at a 0.05 level
- Jarret Allen - increase of .213
- Mike Conley - increase of .205
- Michael Porter - increase of .193
- Russell Westbrook - decreased of .184
ft_pct_df = pd.DataFrame(columns = ['player', 'pre-bubble-made', 'pre-bubble-att', 'bubble-made', 'bubble-att', 'p-val'])

for player in bubble_players_ft_attempts.keys():
    if player in pre_bubble_players_ft_attempts.keys() and pre_bubble_players_ft_attempts[player] > 20 and bubble_players_ft_attempts[player] > 20:
        count = np.array([pre_bubble_players_ft_made[player], bubble_players_ft_made[player]])
        nobs = np.array([pre_bubble_players_ft_attempts[player], bubble_players_ft_attempts[player]])
        stat, pval = proportions_ztest(count, nobs)

        ft_pct_df = ft_pct_df.append({'player': player,
                                      'pre-bubble-made': pre_bubble_players_ft_made[player],
                                      'pre-bubble-att': pre_bubble_players_ft_attempts[player],
                                      'bubble-made': bubble_players_ft_made[player],
                                     'bubble-att': bubble_players_ft_attempts[player],
                                      'p-val': pval}, ignore_index=True)

ft_pct_df['pre-ft-pct'] = (ft_pct_df['pre-bubble-made']/ft_pct_df['pre-bubble-att']).astype(float)
ft_pct_df['bubble-pct'] = (ft_pct_df['bubble-made']/ft_pct_df['bubble-att']).astype(float)
ft_pct_df['ft-pct-diff'] = (ft_pct_df['bubble-pct'] - ft_pct_df['pre-ft-pct']).astype(float)
ft_pct_df = ft_pct_df.reindex(ft_pct_df['ft-pct-diff'].abs().sort_values(ascending=False).index)
ft_pct_df.round(3)
| player | pre-bubble-made | pre-bubble-att | bubble-made | bubble-att | p-val | pre-ft-pct | bubble-pct | ft-pct-diff | |
|---|---|---|---|---|---|---|---|---|---|
| 52 | Jarrett Allen | 147 | 237 | 20 | 24 | 0.038 | 0.620 | 0.833 | 0.213 |
| 1 | Mike Conley | 93 | 117 | 22 | 22 | 0.020 | 0.795 | 1.000 | 0.205 |
| 44 | Michael Porter | 33 | 43 | 24 | 25 | 0.038 | 0.767 | 0.960 | 0.193 |
| 35 | Russell Westbrook | 269 | 346 | 19 | 32 | 0.020 | 0.777 | 0.594 | -0.184 |
| 15 | Khem Birch | 41 | 67 | 18 | 24 | 0.224 | 0.612 | 0.750 | 0.138 |
| 38 | Kristaps Porziņģis | 177 | 228 | 44 | 49 | 0.054 | 0.776 | 0.898 | 0.122 |
| 11 | Dwight Howard | 89 | 180 | 17 | 28 | 0.267 | 0.494 | 0.607 | 0.113 |
| 31 | Brook Lopez | 98 | 121 | 23 | 25 | 0.183 | 0.810 | 0.920 | 0.110 |
| 2 | Rudy Gobert | 228 | 367 | 26 | 36 | 0.231 | 0.621 | 0.722 | 0.101 |
| 41 | Goran Dragić | 170 | 221 | 20 | 23 | 0.270 | 0.769 | 0.870 | 0.100 |
| 16 | Caris LeVert | 116 | 161 | 20 | 32 | 0.279 | 0.720 | 0.625 | -0.095 |
| 22 | Dario Šarić | 79 | 95 | 25 | 27 | 0.223 | 0.832 | 0.926 | 0.094 |
| 48 | Ivica Zubac | 107 | 141 | 14 | 21 | 0.365 | 0.759 | 0.667 | -0.092 |
| 29 | Khris Middleton | 178 | 196 | 26 | 26 | 0.107 | 0.908 | 1.000 | 0.092 |
| 5 | J.J. Redick | 147 | 163 | 18 | 22 | 0.236 | 0.902 | 0.818 | -0.084 |
| 42 | Nikola Jokić | 218 | 268 | 26 | 29 | 0.267 | 0.813 | 0.897 | 0.083 |
| 17 | Ja Morant | 204 | 265 | 22 | 26 | 0.372 | 0.770 | 0.846 | 0.076 |
| 14 | Terrence Ross | 136 | 161 | 21 | 23 | 0.386 | 0.845 | 0.913 | 0.068 |
| 9 | LeBron James | 239 | 343 | 22 | 35 | 0.406 | 0.697 | 0.629 | -0.068 |
| 3 | Brandon Ingram | 283 | 330 | 30 | 38 | 0.265 | 0.858 | 0.789 | -0.068 |
| 39 | Jimmy Butler | 408 | 490 | 27 | 30 | 0.333 | 0.833 | 0.900 | 0.067 |
| 46 | Chris Paul | 225 | 250 | 24 | 25 | 0.328 | 0.900 | 0.960 | 0.060 |
| 18 | Jonas Valančiūnas | 123 | 168 | 19 | 24 | 0.534 | 0.732 | 0.792 | 0.060 |
| 25 | Gordon Hayward | 94 | 111 | 29 | 32 | 0.393 | 0.847 | 0.906 | 0.059 |
| 30 | Giannis Antetokounmpo | 361 | 570 | 27 | 47 | 0.422 | 0.633 | 0.574 | -0.059 |
| 26 | Jaylen Brown | 159 | 216 | 17 | 25 | 0.550 | 0.736 | 0.680 | -0.056 |
| 49 | Joel Embiid | 311 | 382 | 35 | 46 | 0.386 | 0.814 | 0.761 | -0.053 |
| 36 | James Harden | 619 | 719 | 56 | 62 | 0.351 | 0.861 | 0.903 | 0.042 |
| 0 | Donovan Mitchell | 249 | 290 | 27 | 30 | 0.531 | 0.859 | 0.900 | 0.041 |
| 19 | Damian Lillard | 389 | 438 | 45 | 53 | 0.402 | 0.888 | 0.849 | -0.039 |
| 53 | Rudy Gay | 99 | 113 | 21 | 23 | 0.616 | 0.876 | 0.913 | 0.037 |
| 43 | Monte Morris | 51 | 62 | 18 | 21 | 0.715 | 0.823 | 0.857 | 0.035 |
| 34 | Derrick White | 150 | 175 | 28 | 34 | 0.614 | 0.857 | 0.824 | -0.034 |
| 37 | Luka Dončić | 369 | 491 | 43 | 55 | 0.621 | 0.752 | 0.782 | 0.030 |
| 4 | Zion Williamson | 98 | 152 | 16 | 26 | 0.773 | 0.645 | 0.615 | -0.029 |
| 12 | Nikola Vučević | 114 | 146 | 17 | 21 | 0.765 | 0.781 | 0.810 | 0.029 |
| 45 | Shai Gilgeous-Alexander | 254 | 317 | 29 | 35 | 0.699 | 0.801 | 0.829 | 0.027 |
| 20 | Carmelo Anthony | 113 | 134 | 20 | 23 | 0.746 | 0.843 | 0.870 | 0.026 |
| 7 | Kawhi Leonard | 311 | 350 | 38 | 44 | 0.624 | 0.889 | 0.864 | -0.025 |
| 24 | Jerome Robinson | 20 | 29 | 15 | 21 | 0.851 | 0.690 | 0.714 | 0.025 |
| 21 | Devin Booker | 405 | 442 | 47 | 50 | 0.561 | 0.916 | 0.940 | 0.024 |
| 27 | Jayson Tatum | 225 | 279 | 24 | 29 | 0.783 | 0.806 | 0.828 | 0.021 |
| 33 | DeMar DeRozan | 338 | 401 | 38 | 44 | 0.718 | 0.843 | 0.864 | 0.021 |
| 55 | Malcolm Brogdon | 145 | 162 | 21 | 24 | 0.767 | 0.895 | 0.875 | -0.020 |
| 32 | De'Aaron Fox | 215 | 306 | 26 | 36 | 0.807 | 0.703 | 0.722 | 0.020 |
| 54 | Fred VanVleet | 140 | 166 | 25 | 29 | 0.797 | 0.843 | 0.862 | 0.019 |
| 10 | Kyle Kuzma | 96 | 130 | 18 | 25 | 0.848 | 0.738 | 0.720 | -0.018 |
| 47 | Danilo Gallinari | 234 | 264 | 19 | 21 | 0.797 | 0.886 | 0.905 | 0.018 |
| 28 | Marcus Smart | 106 | 127 | 18 | 22 | 0.849 | 0.835 | 0.818 | -0.016 |
| 6 | Paul George | 165 | 187 | 20 | 23 | 0.858 | 0.882 | 0.870 | -0.013 |
| 40 | Bam Adebayo | 236 | 342 | 28 | 40 | 0.898 | 0.690 | 0.700 | 0.010 |
| 50 | Pascal Siakam | 220 | 275 | 17 | 21 | 0.916 | 0.800 | 0.810 | 0.010 |
| 8 | Anthony Davis | 386 | 457 | 58 | 68 | 0.860 | 0.845 | 0.853 | 0.008 |
| 13 | Aaron Gordon | 137 | 203 | 14 | 21 | 0.939 | 0.675 | 0.667 | -0.008 |
| 51 | Kyle Lowry | 255 | 296 | 33 | 38 | 0.907 | 0.861 | 0.868 | 0.007 |
| 23 | Rui Hachimura | 92 | 111 | 19 | 23 | 0.975 | 0.829 | 0.826 | -0.003 |
Matched Pairs T-Test
The effect size of the bubble on free throw percentage increased these 34 players free throw percentage on average by 2.6%. Note that this treats all players equally, regardless of how many free throws they've attempted because we group by each player
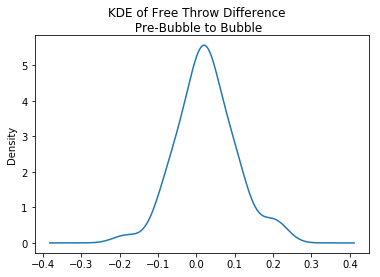
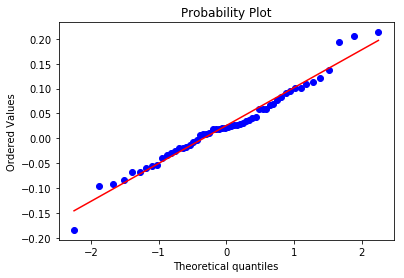
The matched pair's test assumes that the observations are independent of one another and that the dependent variable sould be approximately normally distributed. Plotting a kernal density estimator and a q-q plot, we see that we have approximate normality. The shapiro-wilks test for normality also confirms the assumption of approximate normality
A matched pair's t-test shows a p-value of .01, so we do have enough evidence to reject the null hypothesis that the effect of the bubble on a player's free throw percentage is 0.
fig, ax = plt.subplots()
ax = ft_pct_df['ft-pct-diff'].plot.kde()
fig.suptitle('KDE of Free Throw Difference\n Pre-Bubble to Bubble')
plt.show()

stats.probplot(ft_pct_df['ft-pct-diff'], dist="norm", plot=pylab)
pylab.show()

print('P-value of Shapiro-Wilks Test for Normality = ' + str(round(stats.shapiro(ft_pct_df['ft-pct-diff'])[1],3)))

print('Effect size of the bubble = ' + str(round(ft_pct_df['ft-pct-diff'].mean(),3)))
pval = stats.ttest_rel(ft_pct_df['pre-ft-pct'], ft_pct_df['bubble-pct'])[1]
print('P-value of Matched Pairs T-Test = ' + str(round(pval,3)))
!
P-value of Shapiro-Wilks Test for Normality = 0.426
Effect size of the bubble = 0.026
P-value of Matched Pairs T-Test = 0.013
Conclusion
While the data (as of 8/10/2020) only shows that 4 players have a significant difference in their free throw percentage before the bubble and in the bubble, using a matched pairs t-test, we can conclude that a player's free throw percentage increases in the bubble. The immediate hypothesis would be that this is because of the reduced crowd noise, but other factors are at play here such as how much a player cares about the game (Lakers are in coast mode since locking up the top seed), etc.
As the season continues we will have many more players taking free throws and we will continue to analyze the data.