How Much does Crowd Noise Affect NBA Players? (Season-Final)
Posted on August 11, 2020 in NBA-Basketball
Premise
Basketball is back in the bubble! But it's been drastically different with virtual fans and the lack of crowd noise. I was curious to see the effect that crowd noise had on the players, and the most "controlled" aspect of the game I could think of was free throws. Therefore, I wanted to see if player's free throw percentages improved due to the lack of crowd noise or not.
I used a matched pairs t-test to see whether a "bubble" effect existed on the NBA player's free throw percentage pre-bubble vs in the bubble. One of the disadvantages of the matched pairs t-test was that this treated the pre-bubble data as a single measurement point and the in-bubble data as another measurement point, but the data was actually binomial data.
Therefore, I also used a test of proportions to see whether any players deviated from their pre-bubble free throw shooting percentages
Load the data
I first loaded the box score data that was scraped from basketballreference.com using the code here
I then created dictionaries of each player's pre-bubble / bubble free throws made and free throw attempts. Thankfully no players in the NBA have the same name
import os
from os import path
import pickle
import pandas as pd
from scipy import stats
import numpy as np
import pylab
from statsmodels.stats.proportion import proportions_ztest
import matplotlib.pyplot as plt

def RepresentsInt(s):
    try:
        int(s)
        return True
    except ValueError:
        return False

working_dir = os.getcwd() + "/ft_data"
# Get all pickle files that match basic box score in the 2020 season
pre_bubble_box_scores = dict()
bubble_box_scores = dict()
for file in os.listdir(working_dir):
    if file.endswith(".pickle") and "basic_box_score" in file and "2020" in file:
        with open(working_dir + "/" + file, 'rb') as handle:
            b = pickle.load(handle)
            if 'july' in file or 'august' in file or 'september' in file or 'october' in file:
                bubble_box_scores.update(b)
            else:
                pre_bubble_box_scores.update(b)

pre_bubble_players_ft_attempts = dict()
pre_bubble_players_ft_made = dict()
debug = list()
for key, boxscore in pre_bubble_box_scores.items():
    ft_attempts = boxscore['FTA']
    ft_made = boxscore['FT']
    for index, value in ft_attempts.items():
        if RepresentsInt(value):
            if int(value) != 0:
                if index not in pre_bubble_players_ft_attempts.keys():
                    pre_bubble_players_ft_attempts[index] = int(ft_attempts[index])
                    pre_bubble_players_ft_made[index] = int(ft_made[index])
                else:
                    pre_bubble_players_ft_attempts[index] = pre_bubble_players_ft_attempts[index] + int(ft_attempts[index])
                    pre_bubble_players_ft_made[index] = pre_bubble_players_ft_made[index] + int(ft_made[index])

bubble_players_ft_attempts = dict()
bubble_players_ft_made = dict()
for key, boxscore in bubble_box_scores.items():
    ft_attempts = boxscore['FTA']
    ft_made = boxscore['FT']
    for index, value in ft_attempts.items():
        if RepresentsInt(value):
            if int(value) != 0:
                if index not in bubble_players_ft_attempts.keys():
                    bubble_players_ft_attempts[index] = int(value)
                    bubble_players_ft_made[index] = int(ft_made[index])
                else:
                    bubble_players_ft_attempts[index] = bubble_players_ft_attempts[index] + int(value)
                    bubble_players_ft_made[index] = bubble_players_ft_made[index] + int(ft_made[index])
Create the data frame
Next, I created a dataframe with the columns desired and ran through the players in the bubble to populate the the dataframe. I only took players who had taken at least 30 free throws in the pre-bubble as well as bubble.
- Player
- Pre-Bubble Free Throws Made
- Pre-Bubble Free Throws Attempted
- Bubble Free Throws Made
- Bubble Free Throws Attempted
- P-value of the difference between the two proportions
- Pre-bubble Free Throw %
- Bubble Free Throw %
- Differences of Pre-bubble vs Bubble
Analysis
Test of Proportions
We had a total of 49 players who at the end of the bubble had taken more than 30 free throws in the bubble. Only 5 of them had significantly different free throw percentages at a 0.05 level
- Russell Westbrook - Decrease of 23.5%
- Jerami Grant - Increase of 13.1%
- Eric Gordon - Increase of 12.65%
- Danilo Gallinari - Increase of 10%
- Bam Adebayo - Increase of 9.3%
ft_pct_df = pd.DataFrame(columns = ['player', 'pre-bubble-made', 'pre-bubble-att', 'bubble-made', 'bubble-att', 'p-val'])

for player in bubble_players_ft_attempts.keys():
    if player in pre_bubble_players_ft_attempts.keys() and pre_bubble_players_ft_attempts[player] > 30 and bubble_players_ft_attempts[player] > 30:
        count = np.array([pre_bubble_players_ft_made[player], bubble_players_ft_made[player]])
        nobs = np.array([pre_bubble_players_ft_attempts[player], bubble_players_ft_attempts[player]])
        stat, pval = proportions_ztest(count, nobs)

        ft_pct_df = ft_pct_df.append({'player': player,
                                      'pre-bubble-made': pre_bubble_players_ft_made[player],
                                      'pre-bubble-att': pre_bubble_players_ft_attempts[player],
                                      'bubble-made': bubble_players_ft_made[player],
                                     'bubble-att': bubble_players_ft_attempts[player],
                                      'p-val': pval}, ignore_index=True)

ft_pct_df['pre-ft-pct'] = (ft_pct_df['pre-bubble-made']/ft_pct_df['pre-bubble-att']).astype(float)
ft_pct_df['bubble-pct'] = (ft_pct_df['bubble-made']/ft_pct_df['bubble-att']).astype(float)
ft_pct_df['ft-pct-diff'] = (ft_pct_df['bubble-pct'] - ft_pct_df['pre-ft-pct']).astype(float)
ft_pct_df = ft_pct_df.reindex(ft_pct_df['ft-pct-diff'].abs().sort_values(ascending=False).index)
ft_pct_df.round(3)
| player | pre-bubble-made | pre-bubble-att | bubble-made | bubble-att | p-val | pre-ft-pct | bubble-pct | ft-pct-diff | |
|---|---|---|---|---|---|---|---|---|---|
| 23 | Russell Westbrook | 248 | 317 | 23 | 42 | 0.001 | 0.782 | 0.548 | -0.235 |
| 25 | Jerami Grant | 121 | 163 | 55 | 63 | 0.034 | 0.742 | 0.873 | 0.131 |
| 22 | Eric Gordon | 76 | 100 | 39 | 44 | 0.082 | 0.760 | 0.886 | 0.126 |
| 4 | Pascal Siakam | 194 | 248 | 36 | 53 | 0.109 | 0.782 | 0.679 | -0.103 |
| 20 | Danilo Gallinari | 213 | 243 | 42 | 43 | 0.051 | 0.877 | 0.977 | 0.100 |
| 45 | Kristaps Porziņģis | 158 | 202 | 35 | 40 | 0.182 | 0.782 | 0.875 | 0.093 |
| 15 | Bam Adebayo | 206 | 298 | 98 | 125 | 0.053 | 0.691 | 0.784 | 0.093 |
| 5 | Kyle Lowry | 230 | 267 | 54 | 69 | 0.107 | 0.861 | 0.783 | -0.079 |
| 46 | D.J. Augustin | 132 | 148 | 33 | 34 | 0.155 | 0.892 | 0.971 | 0.079 |
| 19 | Khris Middleton | 168 | 184 | 46 | 55 | 0.103 | 0.913 | 0.836 | -0.077 |
| 7 | Donovan Mitchell | 228 | 264 | 63 | 67 | 0.086 | 0.864 | 0.940 | 0.077 |
| 44 | Tim Hardaway | 112 | 141 | 27 | 31 | 0.326 | 0.794 | 0.871 | 0.077 |
| 3 | Jaylen Brown | 151 | 204 | 60 | 74 | 0.224 | 0.740 | 0.811 | 0.071 |
| 8 | Rudy Gobert | 213 | 343 | 26 | 47 | 0.371 | 0.621 | 0.553 | -0.068 |
| 43 | Luka Dončić | 345 | 459 | 61 | 89 | 0.192 | 0.752 | 0.685 | -0.066 |
| 42 | Carmelo Anthony | 113 | 134 | 30 | 33 | 0.334 | 0.843 | 0.909 | 0.066 |
| 36 | Ivica Zubac | 91 | 123 | 33 | 41 | 0.401 | 0.740 | 0.805 | 0.065 |
| 40 | CJ McCollum | 106 | 145 | 31 | 39 | 0.417 | 0.731 | 0.795 | 0.064 |
| 41 | Damian Lillard | 353 | 397 | 79 | 83 | 0.084 | 0.889 | 0.952 | 0.063 |
| 37 | Lou Williams | 244 | 280 | 35 | 43 | 0.306 | 0.871 | 0.814 | -0.057 |
| 30 | Montrezl Harrell | 207 | 315 | 41 | 68 | 0.396 | 0.657 | 0.603 | -0.054 |
| 26 | Paul Millsap | 95 | 115 | 45 | 58 | 0.427 | 0.826 | 0.776 | -0.050 |
| 33 | Kyle Kuzma | 96 | 130 | 33 | 42 | 0.539 | 0.738 | 0.786 | 0.047 |
| 6 | Norman Powell | 103 | 123 | 27 | 34 | 0.554 | 0.837 | 0.794 | -0.043 |
| 35 | Dwight Howard | 88 | 175 | 30 | 55 | 0.581 | 0.503 | 0.545 | 0.043 |
| 32 | LeBron James | 219 | 319 | 113 | 155 | 0.343 | 0.687 | 0.729 | 0.043 |
| 27 | Monte Morris | 48 | 59 | 41 | 48 | 0.577 | 0.814 | 0.854 | 0.041 |
| 39 | Ja Morant | 193 | 250 | 26 | 32 | 0.605 | 0.772 | 0.812 | 0.040 |
| 17 | Tyler Herro | 52 | 61 | 57 | 64 | 0.523 | 0.852 | 0.891 | 0.038 |
| 1 | Marcus Smart | 103 | 124 | 58 | 67 | 0.526 | 0.831 | 0.866 | 0.035 |
| 11 | Michael Porter | 29 | 37 | 30 | 40 | 0.726 | 0.784 | 0.750 | -0.034 |
| 47 | Tobias Harris | 143 | 177 | 24 | 31 | 0.663 | 0.808 | 0.774 | -0.034 |
| 18 | Giannis Antetokounmpo | 340 | 532 | 64 | 105 | 0.565 | 0.639 | 0.610 | -0.030 |
| 29 | Kawhi Leonard | 284 | 319 | 99 | 115 | 0.401 | 0.890 | 0.861 | -0.029 |
| 14 | Goran Dragić | 147 | 188 | 59 | 73 | 0.640 | 0.782 | 0.808 | 0.026 |
| 13 | Jae Crowder | 88 | 112 | 35 | 46 | 0.733 | 0.786 | 0.761 | -0.025 |
| 38 | Caris LeVert | 109 | 148 | 25 | 33 | 0.803 | 0.736 | 0.758 | 0.021 |
| 28 | Paul George | 165 | 187 | 57 | 66 | 0.690 | 0.882 | 0.864 | -0.019 |
| 16 | Duncan Robinson | 47 | 52 | 39 | 44 | 0.780 | 0.904 | 0.886 | -0.017 |
| 12 | Jimmy Butler | 397 | 473 | 177 | 207 | 0.602 | 0.839 | 0.855 | 0.016 |
| 34 | Alex Caruso | 58 | 76 | 27 | 36 | 0.879 | 0.763 | 0.750 | -0.013 |
| 2 | Kemba Walker | 171 | 198 | 75 | 88 | 0.798 | 0.864 | 0.852 | -0.011 |
| 48 | Joel Embiid | 293 | 360 | 53 | 66 | 0.836 | 0.814 | 0.803 | -0.011 |
| 0 | Jayson Tatum | 215 | 265 | 106 | 130 | 0.923 | 0.811 | 0.815 | 0.004 |
| 10 | Nikola Jokić | 204 | 251 | 72 | 89 | 0.938 | 0.813 | 0.809 | -0.004 |
| 9 | Jamal Murray | 139 | 155 | 72 | 80 | 0.938 | 0.897 | 0.900 | 0.003 |
| 31 | Anthony Davis | 338 | 403 | 165 | 196 | 0.922 | 0.839 | 0.842 | 0.003 |
| 24 | Daniel Theis | 77 | 100 | 27 | 35 | 0.986 | 0.770 | 0.771 | 0.001 |
| 21 | James Harden | 556 | 653 | 133 | 156 | 0.972 | 0.851 | 0.853 | 0.001 |
Matched Pairs T-Test
The effect size of the bubble on free throw percentage increased these 49 players free throw percentage on average by 0.8%. Note that this treats all players equally, regardless of how many free throws they've attempted because we group by each player.
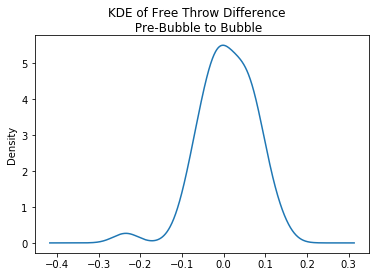
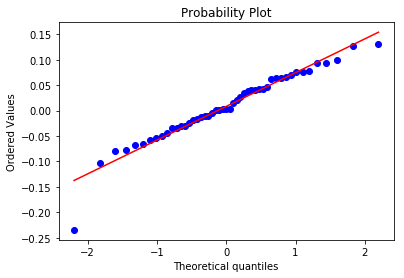
The matched pair's t-test assumes that the observations are independent of one another and that the dependent variable should be approximately normally distributed. Plotting a kernal density estimator and a q-q plot, we see that we have approximate normality. From the q-q plot, we can see that Russell Westbrook was our lone outlier from normality.
A matched pair's t-test shows a p-value of .388, so we do not have enough evidence to reject the null hypothesis that the effect of the bubble on a player's free throw percentage is 0.
fig, ax = plt.subplots()
ax = ft_pct_df['ft-pct-diff'].plot.kde()
fig.suptitle('KDE of Free Throw Difference\n Pre-Bubble to Bubble')
plt.show()

stats.probplot(ft_pct_df['ft-pct-diff'], dist="norm", plot=pylab)
pylab.show()

print('P-value of Shapiro-Wilks Test for Normality = ' + str(round(stats.shapiro(ft_pct_df['ft-pct-diff'])[1],3)))

print('Effect size of the bubble = ' + str(round(ft_pct_df['ft-pct-diff'].mean(),3)))
pval = stats.ttest_rel(ft_pct_df['pre-ft-pct'], ft_pct_df['bubble-pct'])[1]
print('P-value of Matched Pairs T-Test = ' + str(round(pval,3)))
P-value of Shapiro-Wilks Test for Normality = 0.045
Effect size of the bubble = 0.008
P-value of Matched Pairs T-Test = 0.388
Conclusion
The data only shows that 5 players have a significant difference in their free throw percentage before the bubble and in the bubble. Using a matched pairs t-test, we can conclude that a player's free throw percentage does not increase in the bubble.
In an earlier version of the analysis performed on 8/10/2020, the matched t-test did show a significant effect of 2.6%. The fact that we do not see any effect at the end of the bubble could be due to a regression to the mean or the fact that players adjusted to playing in the bubble.